Transforming Manufacturing Through Lean, Process Excellence & Operational Excellence
Pinnacle Logic Consulting drives shopfloor productivity, cost reduction, and operational excellence for manufacturers across India.
35% Avg.
Productivity Improvement
10 Sectors
Manufacturing Domain Focus
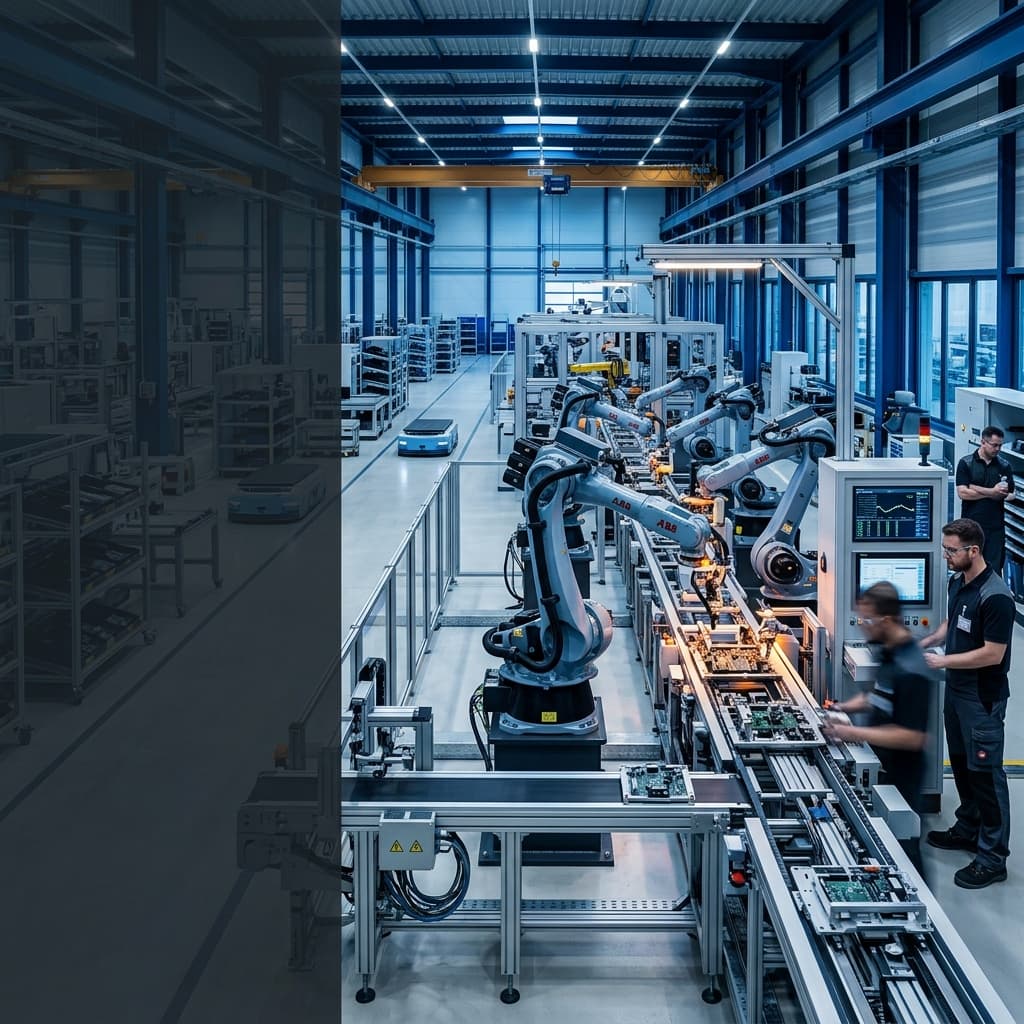
Measurable Operational Impact
Our lean and operational excellence engagements deliver concrete, quantified improvements across critical manufacturing KPIs.
Productivity Improvement
Average output & efficiency gain across assembly lines and manufacturing cells
Changeover Reduction
Setup time compressed using Single-Minute Exchange of Die (SMED) methods
Lead Time Reduction
Order-to-dispatch cycle time reduction through Value Stream Mapping
OEE Improvement
Overall Equipment Effectiveness gain on critical bottleneck machinery
Manpower Optimisation
Workforce efficiency and workload rebalancing without compromising output
Operational Excellence Across Target Sectors
We bring specialized domain know-how and hands-on lean methodologies tailored to the unique operational demands of these key manufacturing industries.
Auto Components
Tier-1 & Tier-2 automotive component machining, sub-assembly, and OEM supply chain optimization.
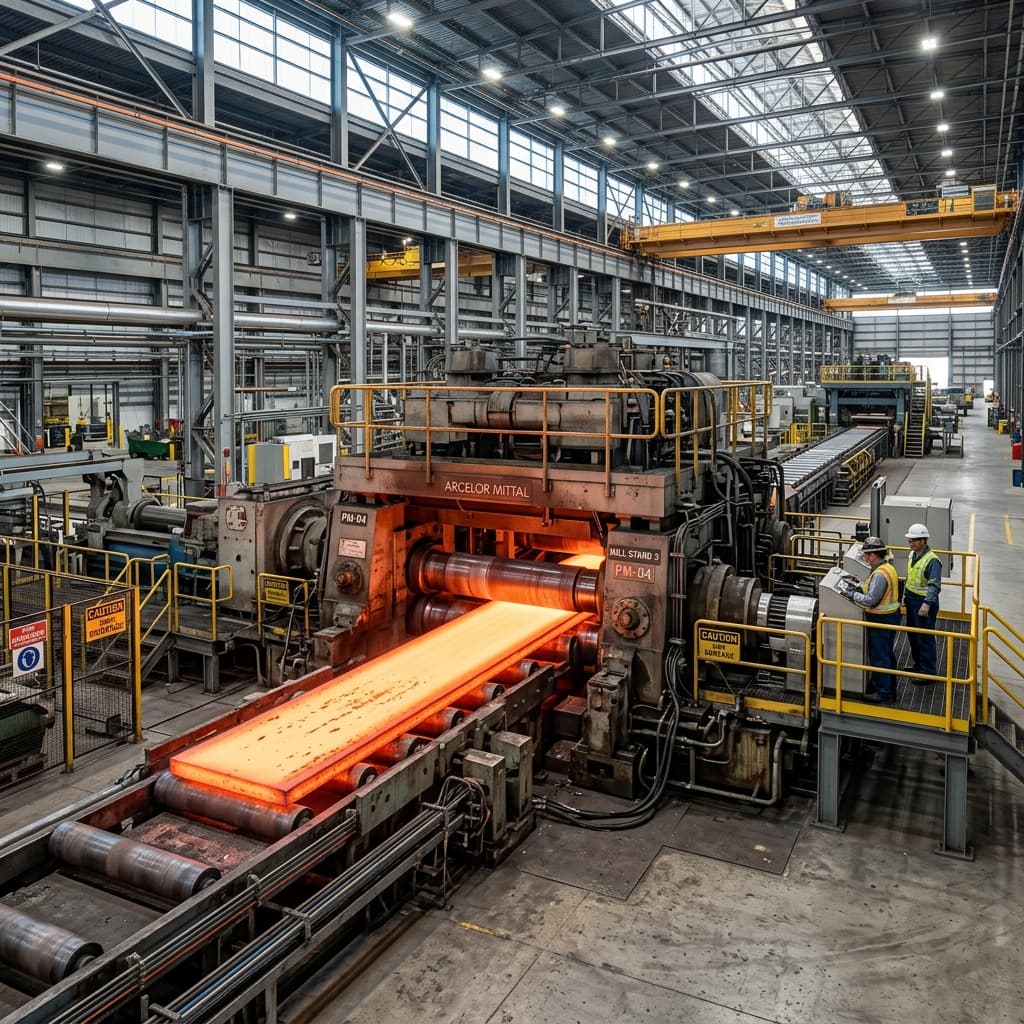
Steel
Integrated steel plants, plate mills, rolling mills, and heavy metals processing facilities.
Foundry
Heavy casting foundries, sand moulding shops, core preparation, and pouring operations.
Packaging
Flexible film extrusion, converting lines, bag manufacturing, and high-speed packaging plants.
Engineering
Precision CNC machining centers, tool manufacturing, gearboxes, valves, and gear cutting.
Heavy Manufacturing
Structural steel fabrication, heavy machinery assembly, capital equipment, and crane operations.
Wire & Cables
Continuous wire drawing, extrusion insulation lines, stranding, and power cabling facilities.
Textile
Spinning mills, yarn processing, loom weaving sheds, and garment assembly operations driving efficient production and market-ready output.
FMCG
High-speed bottling, cartoning, liquid compounding, sachet packaging, and SKU changeover speed.
Electricals & Electronics
Switchgear, transformer coil winding, PCB SMT line feeder setups, and Poka-Yoke wiring harness assembly.
Comprehensive Manufacturing Capabilities
Explore our expanded consulting practice areas designed to drive shopfloor efficiency, waste elimination, and bottom-line productivity.

Lean Manufacturing
“Eliminate waste, streamline shopfloor operations, and instill continuous improvement discipline.”
Manufacturing plants suffer from invisible shopfloor waste, excessive motion, overproduction, and defects that inflate operating costs and degrade productivity.
- 25-40% reduction in non-value-adding activity time
- 30% improvement in shopfloor space utilization
- 20% decrease in operational defects and rework
Why Manufacturers Choose Pinnacle Logic
We combine deep manufacturing expertise with hands-on implementation to deliver measurable improvements in productivity, cost, quality, and operational performance.
 Business Value
Proven Business Impact
We focus on delivering measurable improvements in productivity, cost reduction, quality, and operational performance.
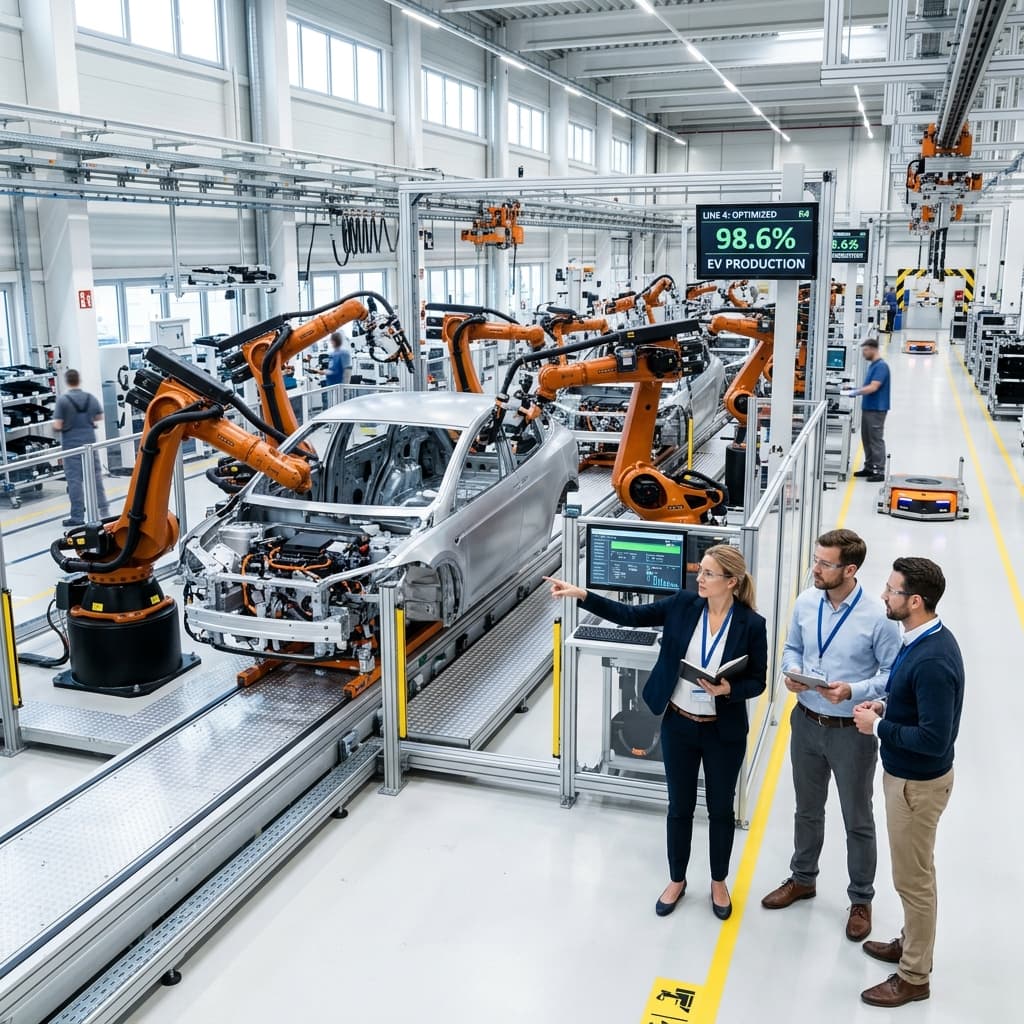 Shopfloor Execution
Hands-on Implementation
We work alongside your teams to implement improvements on the shop floor, ensuring practical solutions and sustainable results.
Rigor & DataData-driven Problem Solving
Every recommendation is backed by structured analysis, operational data, process observation, and performance measurement.
 Proven Science
Lean Manufacturing & Process Excellence
We apply proven Lean Manufacturing, Industrial Engineering, and continuous improvement methodologies to eliminate waste and improve operational performance.
 Domain Leadership
Manufacturing Domain Expertise
Extensive experience across manufacturing environments, delivering productivity improvement, cost optimisation, process excellence, and operational transformation.
 Permanent Impact
Sustainable Results
We build standard work, performance dashboards, KPIs, and governance systems that help organisations sustain improvements long after implementation.
Expected Framework Outcomes
Our structured operational transformation framework delivers concrete, measurable performance improvements across critical manufacturing KPIs.
Higher Productivity
35% average labor & line throughput gain across plant operations
Reduced Costs
Lower scrap, material waste & conversion cost without Capex
Higher OEE
72% Changeover Reduction & higher OEE uplift on bottleneck machinery
Reduced Lead Time
30% faster order-to-dispatch turnaround time
Better Material Flow
45% reduction in material travel distance & handling waste
Proven Case Studies & Operational KPIs
Assembly Line Balancing & Layout Optimisation
Uneven work allocation across 14 sub-assembly stations caused severe line starvation, operator idle time, and low daily throughput.
Plate Mill Capacity Optimisation
Severe throughput bottlenecks at plate shearing lines and uncoordinated reheating schedules restricted total plant volume.
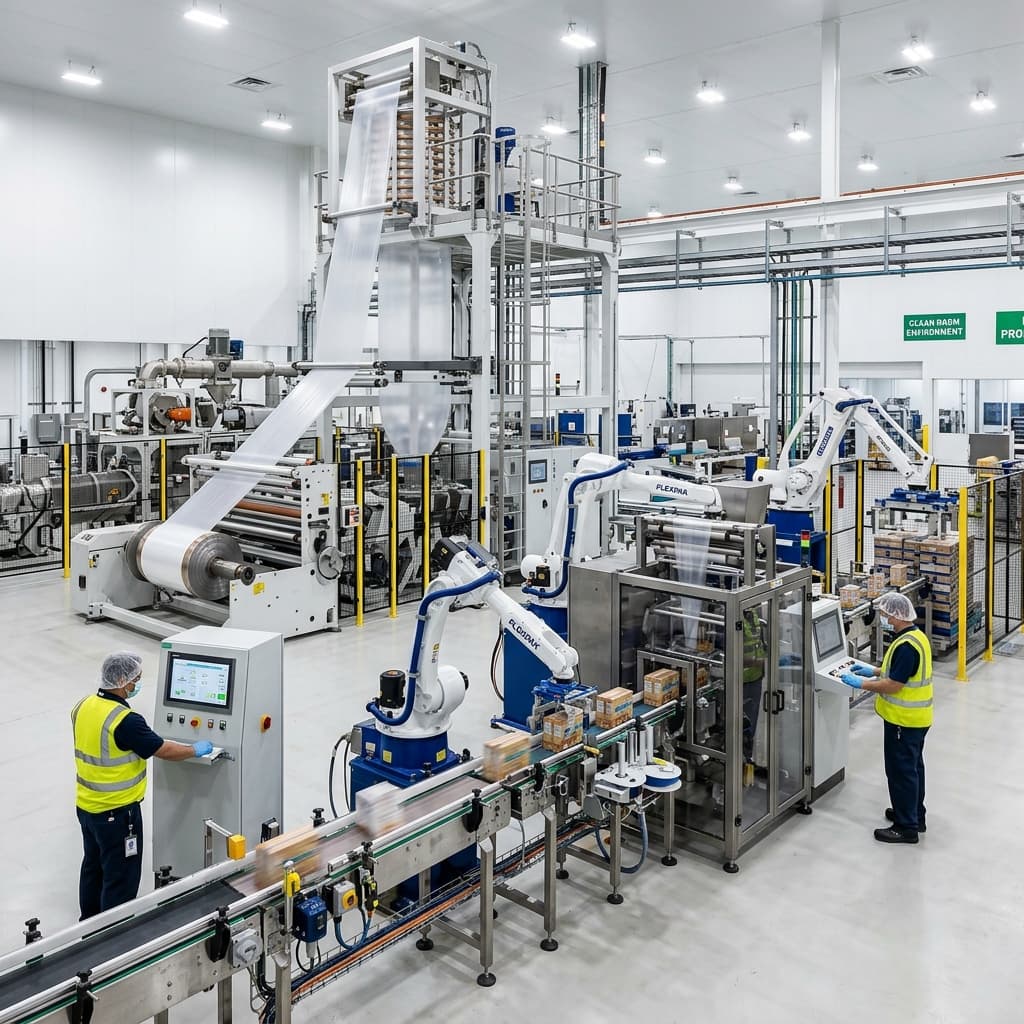
OEE & Quick Changeover Optimisation
High-runner extrusion film lines lost 12+ hours per die changeover due to disorganized tool preparation and unstandardized procedures.
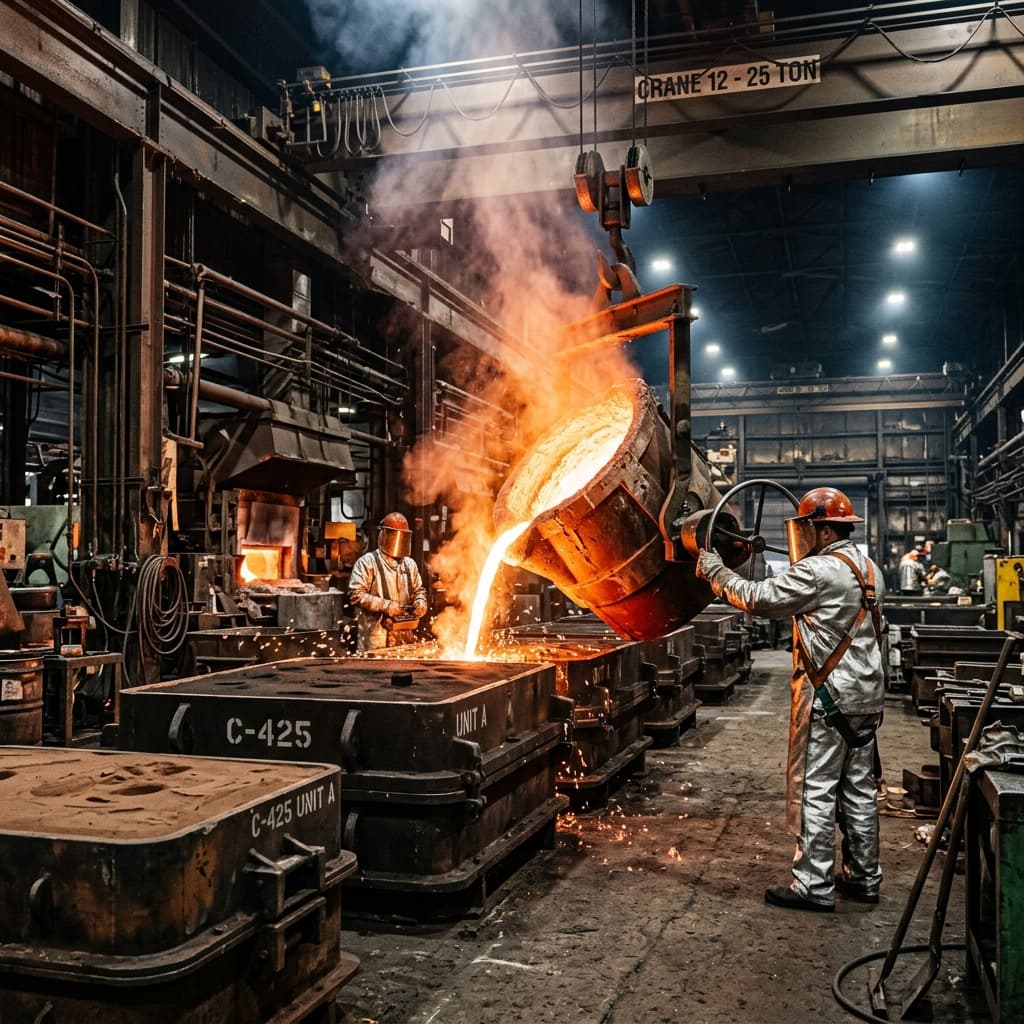
Workforce Productivity Improvement
Heavy casting foundry suffered from high contract headcount dependency, manual flask handling delays, and poor spatial layout.
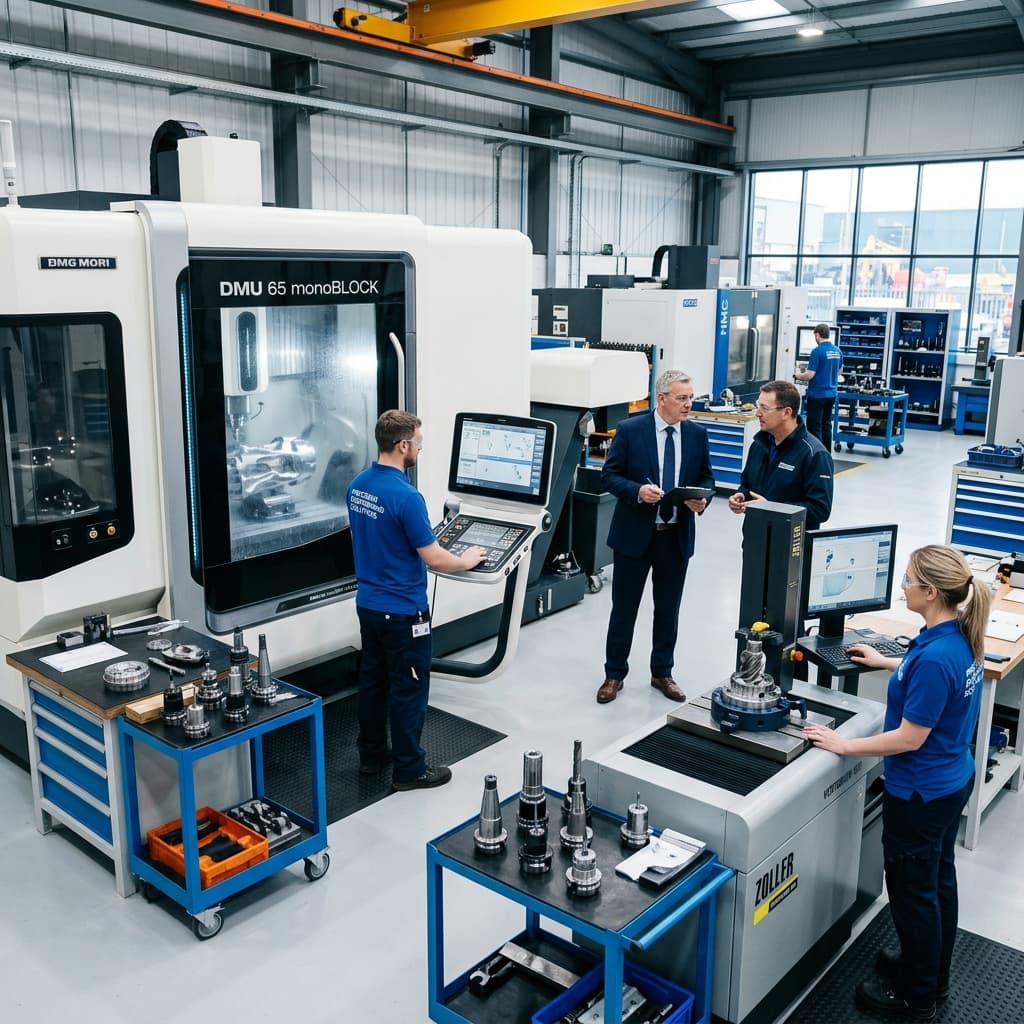
CNC Setup & Spindle Optimisation
Custom machining shop lost 35% of CNC machine capacity to batch setup delays, fixture zero-setting, and CMM inspection waits.
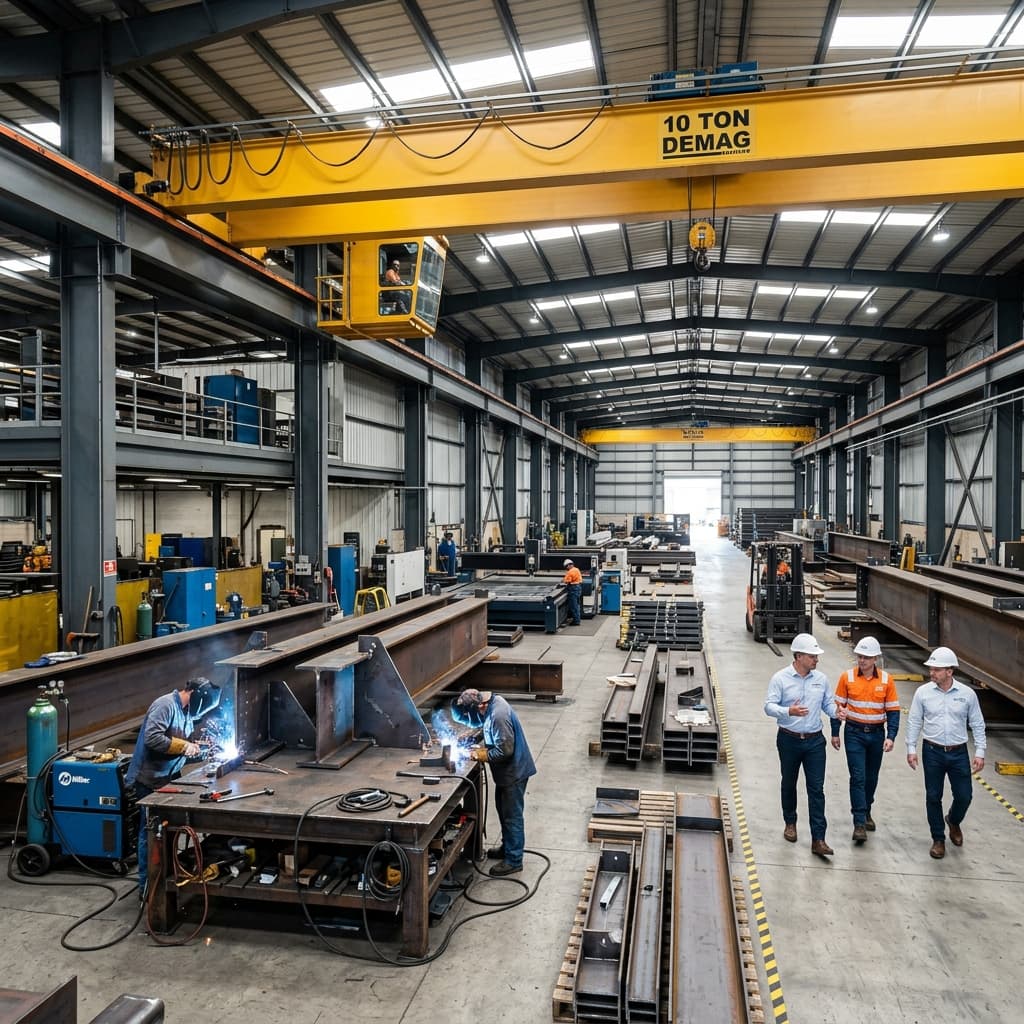
Fabrication Layout & Lead Time Optimisation
Heavy structural fabrication facility suffered from crisscrossing overhead crane movements, beam backtracking, and congested welding bays.
Manufacturing Challenges We Solve
We address structural shopfloor bottlenecks and operational losses with tailored lean engineering solutions.
Low OEE & Frequent Breakdowns
Unplanned downtime, minor stops, and speed losses trap machine effectiveness between 40-60%.
Excess Manpower & Line Imbalance
Uneven task distribution leads to operator idle time, line starvation, and inflated labor cost per unit.
Long Lead Times & WIP Congestion
Orders get stuck in shopfloor bottlenecks, tying up working capital and causing late customer deliveries.
Start Your Manufacturing Transformation
Identify productivity opportunities, reduce operational costs, and improve manufacturing performance.
Contact our manufacturing consultants to discuss your operational challenges. We conduct a structured shopfloor assessment to evaluate your manufacturing operations and identify improvement opportunities.
- Production Flow & Bottleneck Assessment
- Productivity & Manpower Analysis
- OEE & Equipment Performance Review
- Material Flow & Waste Identification
- Capacity Improvement Opportunities
- Cost Reduction Potential
- Implementation Roadmap
Direct Channels:
Request a Manufacturing Assessment
Submit your factory details below to discuss your operational challenges with our consultants.